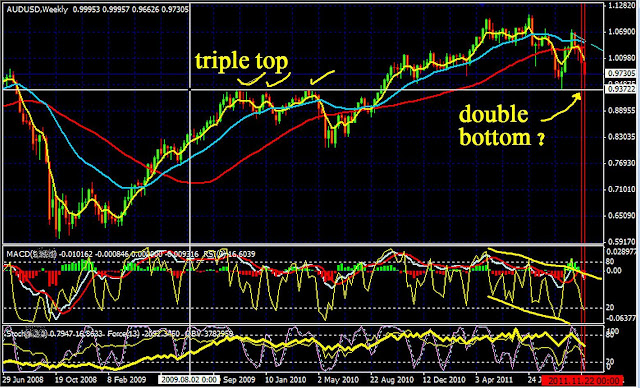
Pulling up monthly and weekly charts, putting things in perspective. I don't trade from these times but I do use them for reference when bombarded with daily/ minute by minute doom and gloom reports.
First up is AUD/USD :
On a weekly chart we can see a past triple top that should give us support around .9370* and would also create a double bottom.
RSI, MACD signal lines and STOCH'S seem to support this target as well.
US/CAD:
Again looking at a weekly chart, it seems to be heading toward 1.0670* area for ...5x...at least
Looking at the indicators: RSI, STOCH, MACD still climbing with the 50 sma flatish...hooking upwards ever so slightly...keeping an eye on that
EUR/US:
Monthly chart...we are about half way into this descending channel...NO it's no guarantee it will follow the path down but once we break that center line...the odds get better.
Like I stated earlier, few of us trade from a long time frame, it's just something I keep an eye on.
at present I am long US/JPY and will add smaller positions if it drops...REASON: INTERVENTION
I am also taking longs off the 50 sma with the US/CAD...30m and 1H charts


No comments:
Post a Comment