As in the past, when we get volatility extreme, the "math" slides off course...
I HAD WARNINGS
and yet...I "knew" better....#FAIL
Yeah...lessoned Learned
2 days ago 18 pairs I track 2 were "on target"...<---only once before has that happened out of the last...8/9 months.
Yesterday...9 out of 18 on target
Generally I get 12 to 13 on any given day.
Keep in mind 3 pairs were just added to my list.
I don't expect everyone to understand, it is a system that works for me so I'm sticking with it and in the future I will just have to "learn" to pay attention to the 'warnings" and not trade until the "math" comes back in line.
My EUR/GB "swing" is still negative *25pips...not so bad..if the math is right ?...I should be break even or a little ahead in the next 24 hours ( I'm showing a lower high than previous top)
-------------------
levels I'm looking for:
CHF/JPY: 84.43/ 83.64....(40P RANGE)
EUR/CHF: Looking for 1.3415* low for long entry (20p buffer)..60+ p
USD/CAD: Looking for 1.0205 low for long entry...target 50+ ( My upper level is about 1.0309/1.0320)
I'll put these on my charts and keep watch..
** Just trading ideas based on my own mathematical equations....NEVER A GUARANTEE

THESE ARE NOT TRADE SIGNALS Calculating probable "Turning Points" Not necessarily the Daily swing (although this is common). Generally "levels" are hit during the U.K. Trading sessions * I use a 15 to 18 pip buffer (+ spread) Most "turns" are good for 25+ pips BUT, not uncommon for 50+ pip runs I try to add possible target amounts based on averages. NO GUARANTEES...IT IS FOREX!!
Thursday, October 21, 2010
Wednesday, October 20, 2010
IMO
Re-Cap?
Sure..stopped out on EUR/GB...almost took out my monthly swing position too......went short .8820 putting stop above monthly Trend line/taking a bit of profit out.
China News coming out in a few hours...
2 choices:
#1. STAY OUT and we will be on better ground next week
#2. Look for spikes in AUD/NZ/EURO...and U.S. weakness
Suddenly the MEDIA is concerned about Japan and their debt...economy...yen strength...trying to talk it down/weaken...
Pairs nearing CHANNEL "Tops"...AUD/CHF, EUR/CHF...possibly short spike after China News
Did I mention..STAY OUT?
Tuesday, October 19, 2010
virus scans..
Just when You REALLY don't have the time...
I'm rushed...
EUR/GB: .8778 /.8704 ( LOOK AT CHART/ LEVELS IN BLUE).

I'm rushed...
EUR/GB: .8778 /.8704 ( LOOK AT CHART/ LEVELS IN BLUE).

Monday, October 18, 2010
re-cap & update
EUR/GB: THE CHART TELLS THE STORY...

US/CHF: Once again...math rules..

US/CAD....ok...it was bound to happen ...not much going on there..

GB/CHF:...


May be worth keeping an eye on for a possible short

US/CHF: Once again...math rules..

US/CAD....ok...it was bound to happen ...not much going on there..

GB/CHF:...

Getting too "sloppy"...8 pip spread and 40+ pip moves...time to put that one away for now....we had a great run, but the equation is changing.
*..I am noticing this across the board though and tonight I'm only posting 2 and a "heads -up" on a possible trade looming with AUD/CHF
SO,
EUR/GB: .8806 / .8735 AGAIN LOOKING FOR 40+...Keep an eye on levels /if price hits top, then bottom and reverses...look for possible repeat/ at least 50%
US/CHF: .9643 / .9539...Seems to be a bit range bound for now with downward pressure...looking for 50 p move
NOW...
AUD/CHF: Look at chart

Sunday, October 17, 2010
re-cap Friday & new stuff
Friday 15th
EUR/GB called .8814/.8746
Looking to chart, I was over by 20 pips (15 to 18p buffer + spread) 19/22...add a triple top out..yeah I took that...trade as you see it and it did hit the .8746 level..no bounce....it was a judgement call for sure.


=========================================================================
=========================================================================
Going over my list of pairs, I had to delete a few due to spread and actual pip movement during the day...cutting down on risk
I don't want anything over an 8 spread and even with that it has to move 60+
So...CAD/JPY <---GONE
NZD/JPY <--GONE
Replaced with: EUR/CHF, GB/AUD & AUD/CHF, these I will work on and see if I can nail a predictable pattern...all in all I track 18 pairs, picking 4 or 5 (sometimes 3) to post here.
Simply don't have time to lay out all 18 and a few of those are still "work in progress".
There is no 'simple' equation to just post and let any of you figure it out daily, I do 4 to 5 calculations on some pairs and 2 to 3 on others...each move at different 'speeds' up and down....and it fluctuates.
Getting this "perfect" is an illusion as I will never be able to predict Volume on any given day or lot size/money flow, one way or another.
I stress to you these "levels" are NOT TRADING SIGNALS...Even though at times it may appear that way being only a few pips off.
Use these "Levels" as you would a pivot point or an "over bought/over sold" indicator, read your candle stick pattern/look for more confirmation.
--------------------------------------------------------------------------------------------------------
New Stuff
--------------------------------------------------------------------------------------------------------
EUR/GB: .8780 / .8701 (40p )
US/CHF: .9635 / .9530 ( 45p)
US/CAD: 1.0148 /1.0054 (40+)
GB/CHF: 1.5407 / 1.5253 (65+)
C-YA Tomorrow
EUR/GB called .8814/.8746
Looking to chart, I was over by 20 pips (15 to 18p buffer + spread) 19/22...add a triple top out..yeah I took that...trade as you see it and it did hit the .8746 level..no bounce....it was a judgement call for sure.

US/CAD: called 1.0093/ 1.0003
back to chart...
8 pips from target level giving us a 64 pip run

GB/CHF: called 1.5322/ 1.5180
at 1.5324 /2 pips over we had a 35 pip drop..OK...not huge..was expecting 70+...didn't happen

CHF/JPY: called 85.80 / 85.10
@ 85.10 we had a 13 pip bounce..not great considering the spread
but
#2 @ 85.10...+26...I watch those levels for consolidation or turns and YES i took that

=========================================================================
Going over my list of pairs, I had to delete a few due to spread and actual pip movement during the day...cutting down on risk
I don't want anything over an 8 spread and even with that it has to move 60+
So...CAD/JPY <---GONE
NZD/JPY <--GONE
Replaced with: EUR/CHF, GB/AUD & AUD/CHF, these I will work on and see if I can nail a predictable pattern...all in all I track 18 pairs, picking 4 or 5 (sometimes 3) to post here.
Simply don't have time to lay out all 18 and a few of those are still "work in progress".
There is no 'simple' equation to just post and let any of you figure it out daily, I do 4 to 5 calculations on some pairs and 2 to 3 on others...each move at different 'speeds' up and down....and it fluctuates.
Getting this "perfect" is an illusion as I will never be able to predict Volume on any given day or lot size/money flow, one way or another.
I stress to you these "levels" are NOT TRADING SIGNALS...Even though at times it may appear that way being only a few pips off.
Use these "Levels" as you would a pivot point or an "over bought/over sold" indicator, read your candle stick pattern/look for more confirmation.
--------------------------------------------------------------------------------------------------------
New Stuff
--------------------------------------------------------------------------------------------------------
EUR/GB: .8780 / .8701 (40p )
US/CHF: .9635 / .9530 ( 45p)
US/CAD: 1.0148 /1.0054 (40+)
GB/CHF: 1.5407 / 1.5253 (65+)
C-YA Tomorrow
Thursday, October 14, 2010
Quick re-cap & new levels
RE-CAPPAGE..
EUR/CAD:...Alright..keep in mind levels are for the turn..GOOD REASON WHY I refrain from the word "SWING" as clearly it was neither TOP or BOTTOM..
BUT...A few pips could have been made...I didn't take this trade


EUR/CAD:...Alright..keep in mind levels are for the turn..GOOD REASON WHY I refrain from the word "SWING" as clearly it was neither TOP or BOTTOM..
BUT...A few pips could have been made...I didn't take this trade

EUR/GB: Much better...

gb/chf:... NICE

CHF/JPY: Double dipper 50p X2

======================================================================
======================================================================
MOVING ON....
EUR/GB: .8814 / .8746 ...Looking for 40+
US/CAD: 1.0093 / 1.0003 ....30+
GB/CHF: 1.5322 / 1.5180 ....70+
CHF/JPY: 85.80 / 85.10 ....40+
I'll go over all pairs on weekend as spreads are getting huge on some...not worth trading...taking a crack at EUR/CHF...Will update...NZ/JPY <--GONE..LOOKING AT 12 POINT SPREAD
NEWS: Japan/China/Euro overnight...= volatility...no use taking chances...15 to 18 pip margin in play
Wednesday, October 13, 2010
re-cap and new levels
ok....CHARTS!!!!
EUR/CAD:


EUR/CAD:

EUR/GB:

US/CAD:

GB/CHF:

NZ/JPY:..OK...COMPLETE MISS

should have studied the 4H chart instead as it bounced off top line...

=============================================================
NEW LEVELS: (DIRECTIONAL TURN)
==========================================================
EUR/CAD: 1.4068 / 1.3952 ( 35+ pip moves)
EUR/GB: .8810 / .8741 (35+)
GB/CHF: 1.5312 / 1.5160 (65+)..pattern seems to be one level within 15 or less
CHF/JPY: 85.78 / 85.02 (50+)
*Once again, look for turn at either level.., best case scenario we bounce between levels getting repeat moves...2 at most/last bounce cut by half.
Always look to indicators for confirmation...levels are based on math probabilities...never a guarantee
Tuesday, October 12, 2010
Home from the Holidays
Ok,
Interesting data from last week.
Notes for next NFP (and YES..The MATH worked even with the volatility the projected levels were in range )
It's a learning process
Anyway...
Levels I'm looking at:
EUR/CAD: 1.4106 / 1.4000 (avg. 55p move)
EUR/GBP: .8841 / ..8769 (avg. 35p)
US/CAD: 1.0146 /1.0057 (avg 40p)
GB/CHF: 1.5195 / 1.5059 (avg 65p +)
NZ/JPY: 62.18 / 61.50 * NOTE...Daily trend line top about 62.27 ( avg 40 p)
** starting to see levels widening, making adjustments as I go. Still believe 15/18 pip buffer should suffice.
Wednesday, October 6, 2010
A look back and ahead
.Quickly from yesterdays levels...
US/CAD slight bounce (20p) from 1.0110 <---My level was 1.0114...not much action there
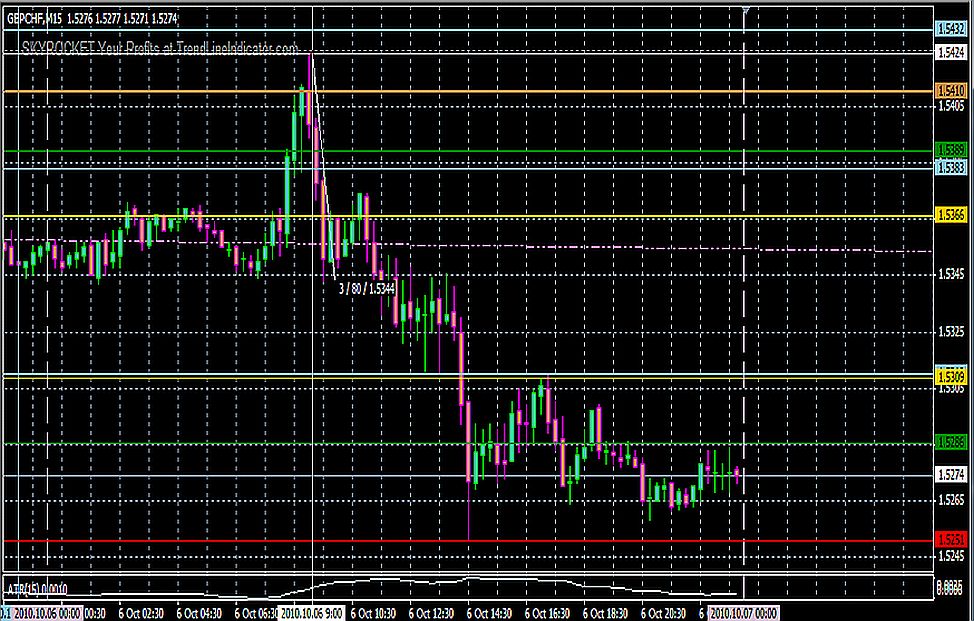
GB/CHF: see chart/...4 pips under for an 80 pip bounce


US/CAD slight bounce (20p) from 1.0110 <---My level was 1.0114...not much action there
GB/CHF: see chart/...4 pips under for an 80 pip bounce
CHF/JPY: see chart...20 & 30 p bounces....8pips over TOP & 11 over BTM (within 15-18p buffer)
.NZ/JPY 8 pips from BTM level (61.90 posted)...actual 61.98 for 50* pip bounce/ 2 pips from TOP level
=================================================================
Onward:
Looking back at last month at this time, I'll go with what worked. (NFP week)
No guarantees it will work this time around though
AUD/JPY: 81.32 TOP / 80.74 BTM level....if it stays in this range look for repeats/ 45 to 60 pips
GB/CHF:1.5327 TOP / 1.5189 BTM..on a roll with this one...70+ pip moves
CHF/JPY: 86.43 TOP/ 85.89 BTM...30 PIP targets
NZ/JPY: 62.33 TOP / 62.00 BTM...30/50 PIP RANGE
EUR/CAD: 1.4136 TOP / 1.4020 BTM...Keep eye on upper level as it's hitting this resistance now several times/check daily chart
TONS OF NEWS /CABLE etc overnight/rules in play/15/18 pip buffer...trade safe...always next week to get better chances
Holiday here this weekend and I'm going away for a few days...I'll be back probably posting Tuesday for Wednesday
Tuesday, October 5, 2010
Gotta love that GB/CHF...
I'M liking this more and more...7 pips off the BTM for a 80p gain.

US/CAD 5 pips from TOP (1.0266 posted) for a 70 pip run

US/CHF, under by -23 pips (sticking with rules 15-18 pips) NO TRADE (DON'T BLAME YOU IF YOU DID THOUGH..as it dropped about 40p
------------------------------------------------------------------------------
New stuff
US/CAD: 1.0195 TOP/ 1.0114 BTM may not move much considering News in the A.M.
GB/CHF: 1.5420 TOP / 1.5282 BTM
CHF/JPY: 86.42 TOP / 85.85 BTM
NZ/JPY: 62.52 TOP / 61.90 BTM
*KEEP in mind Japan News coming out overnight, and EURO/ GDP & German Factory orders...USUALLY we see a MAJOR slowdown as we wait for U.S. News.
US/CAD 5 pips from TOP (1.0266 posted) for a 70 pip run
US/CHF, under by -23 pips (sticking with rules 15-18 pips) NO TRADE (DON'T BLAME YOU IF YOU DID THOUGH..as it dropped about 40p
------------------------------------------------------------------------------
New stuff
US/CAD: 1.0195 TOP/ 1.0114 BTM may not move much considering News in the A.M.
GB/CHF: 1.5420 TOP / 1.5282 BTM
CHF/JPY: 86.42 TOP / 85.85 BTM
NZ/JPY: 62.52 TOP / 61.90 BTM
*KEEP in mind Japan News coming out overnight, and EURO/ GDP & German Factory orders...USUALLY we see a MAJOR slowdown as we wait for U.S. News.
Monday, October 4, 2010
Rough night ahead?
Looking at the schedule
Hard to pick something that won't go ballistic with a fat surprise..
Hopefully we can get our targets quick and leave the carnival ride for someone else.
Good time to practice strict rules with these levels:
US/CHF: .9761 TOP/ .9680 BTM....<--15-18 pip buffer both ends (40 to 55 pip range)
US/CAD: 1.0266 TOP/ 1.0187 BTM <--ONE OR THE OTHER/Don't count on both hitting (40/50pip range)
GB/CHF: 1.5435 TOP/1.5310 BTM <--If it is out by 18 pips ..IT'S OUT..Once again BIG moves with this pair, hitting 9 out of 9 days on one or both within the buffer zone. (70 to 120+ pip range)
These are not TRADE SIGNALS, Just areas to watch for directional turn.
Sunday, October 3, 2010
Back to "Blogger"
http://hideous-fibs.sosblog.com
Yes, same guy...Had enough of that "blog", very problematic...
I'll just continue on and if you stumble across this, you can click above link to see a few months of results. I'm not one to 'self-promote' , not selling anything.
I use the 'other' Twitter account to post "Levels I'm watching" with a %% (stock-ly) click link and sign up if you want http://stock.ly/member/register
THE "Other" Twitter account, the goal is to keep that one "pure", trade ideas/ trade related info only.
======================================================================
* Levels Posted:
Basically, the calculations started by finding the predicted range "High" & "Low" turning points for the next day, refinements and adjustments along the way have narrowed this to the "Turn" of direction...not exactly the "Swing" point as the "High" of the day can be greater as the day progresses on some pairs.
What you will 'see' though is that these "Levels" have a high probability of reversing direction for a 30 + pip move, many times it's much more and occasionally it's a bit less (15 to20 pips)..and of course a "Complete miss" is always a factor....it's forex...expect the unexpected.
http://www.forextrading-ea.com/
In part, the 'levels' I post use a similar mathematical formula used in a "Trading Bot" .
* How to use:
I would suggest adding these "Levels" to your chart with a trend line and use as a guide along with indicators you are accustomed to using...Bollinger Bands, keltner channels, RSI, force, etc etc.
Whatever you use to gauge/identify a price reversal and if price is near one of those levels...looking weak, over bought/over sold, chances are (mathematical probability) direction is about to change.
It's been a few months since I started posting these levels (3rd Blog)...the first one was deleted (thank me later), the second blog (above link) will stay until I have a "History" here to look back on.
"On Paper", I have worked on the "math" for over 7 months and began posting "Levels" in July.
CHART BELOW IS AN EXAMPLE OF LEVELS POSTED ON September 27/10 for 28th on US/CHF : US/CHF: .9890 TOP / .9820 BTM http://hideous-fibs.sosblog.com/The-first-blog-b1/Just-levelsno-re-cap-2night-b1-p31.htm

As you can see, the BTM level .9820 (+2) was area of direction change, BUT NOT extreme "Low" for the day. TOP level was -15 (well within 20 pip buffer) <---again depending on experience/ability etc., could have been Trade #2.
The whole idea is to limit exposure, make your pips and move on.
Yes, same guy...Had enough of that "blog", very problematic...
I'll just continue on and if you stumble across this, you can click above link to see a few months of results. I'm not one to 'self-promote' , not selling anything.
I use the 'other' Twitter account to post "Levels I'm watching" with a %% (stock-ly) click link and sign up if you want http://stock.ly/member/register
THE "Other" Twitter account, the goal is to keep that one "pure", trade ideas/ trade related info only.
======================================================================
* Levels Posted:
Basically, the calculations started by finding the predicted range "High" & "Low" turning points for the next day, refinements and adjustments along the way have narrowed this to the "Turn" of direction...not exactly the "Swing" point as the "High" of the day can be greater as the day progresses on some pairs.
What you will 'see' though is that these "Levels" have a high probability of reversing direction for a 30 + pip move, many times it's much more and occasionally it's a bit less (15 to20 pips)..and of course a "Complete miss" is always a factor....it's forex...expect the unexpected.
http://www.forextrading-ea.com/
In part, the 'levels' I post use a similar mathematical formula used in a "Trading Bot" .
* How to use:
I would suggest adding these "Levels" to your chart with a trend line and use as a guide along with indicators you are accustomed to using...Bollinger Bands, keltner channels, RSI, force, etc etc.
Whatever you use to gauge/identify a price reversal and if price is near one of those levels...looking weak, over bought/over sold, chances are (mathematical probability) direction is about to change.
It's been a few months since I started posting these levels (3rd Blog)...the first one was deleted (thank me later), the second blog (above link) will stay until I have a "History" here to look back on.
"On Paper", I have worked on the "math" for over 7 months and began posting "Levels" in July.
CHART BELOW IS AN EXAMPLE OF LEVELS POSTED ON September 27/10 for 28th on US/CHF : US/CHF: .9890 TOP / .9820 BTM http://hideous-fibs.sosblog.com/The-first-blog-b1/Just-levelsno-re-cap-2night-b1-p31.htm
As you can see, the BTM level .9820 (+2) was area of direction change, BUT NOT extreme "Low" for the day. TOP level was -15 (well within 20 pip buffer) <---again depending on experience/ability etc., could have been Trade #2.
The whole idea is to limit exposure, make your pips and move on.
Subscribe to:
Posts (Atom)